Housing market shift: This interactive map shows where sellers—or buyers—have more power
Fast CompanyWant more housing market stories from Lance Lambert’s ResiClub in your inbox? Subscribe to the ResiClub newsletter.
In the face of strained housing affordability, some regional housing markets are shifting in buyers favor—just look at Zillow’s Market Heat Index.
A higher score indicates a hotter metro-level housing market where sellers have more power. A lower score indicates a colder metro-level housing market where buyers have more power.
According to Zillow, a score of 70 or above indicates a strong sellers market. Meanwhile, a score from 55 to 69 is a sellers market, and a score from 44 to 55 is considered a neutral market. On the other end of the spectrum, a score from 28 to 44 indicates a buyers market, while a score of 27 or below is a strong buyers market, according to Zillow.
Among the 200 largest metro area housing markets, these 10 are the hottest markets, where sellers have the most power:
- Rochester, NY: 154
- Syracuse, NY: 102
- Buffalo, NY: 95
- Albany, NY: 88
- Hartford, CT: 88
- San Jose, CA: 84
- Springfield, MA: 82
- Binghamton, NY: 80
- Norwich, CT: 79
- Manchester, NH: 78
Among the 200 largest metro area housing markets, these 10 are the coldest markets, where buyers have the most power:
- Beaumont, TX: 13
- Gulfport, MS: 14
- Longview, TX: 23
- Lubbock, TX: 23
- Brownsville, TX: 26
- Macon, GA: 27
- Waco, TX: 30
- Gainesville, FL: 30
- Naples, FL: 31
- Cape Coral, FL: 33
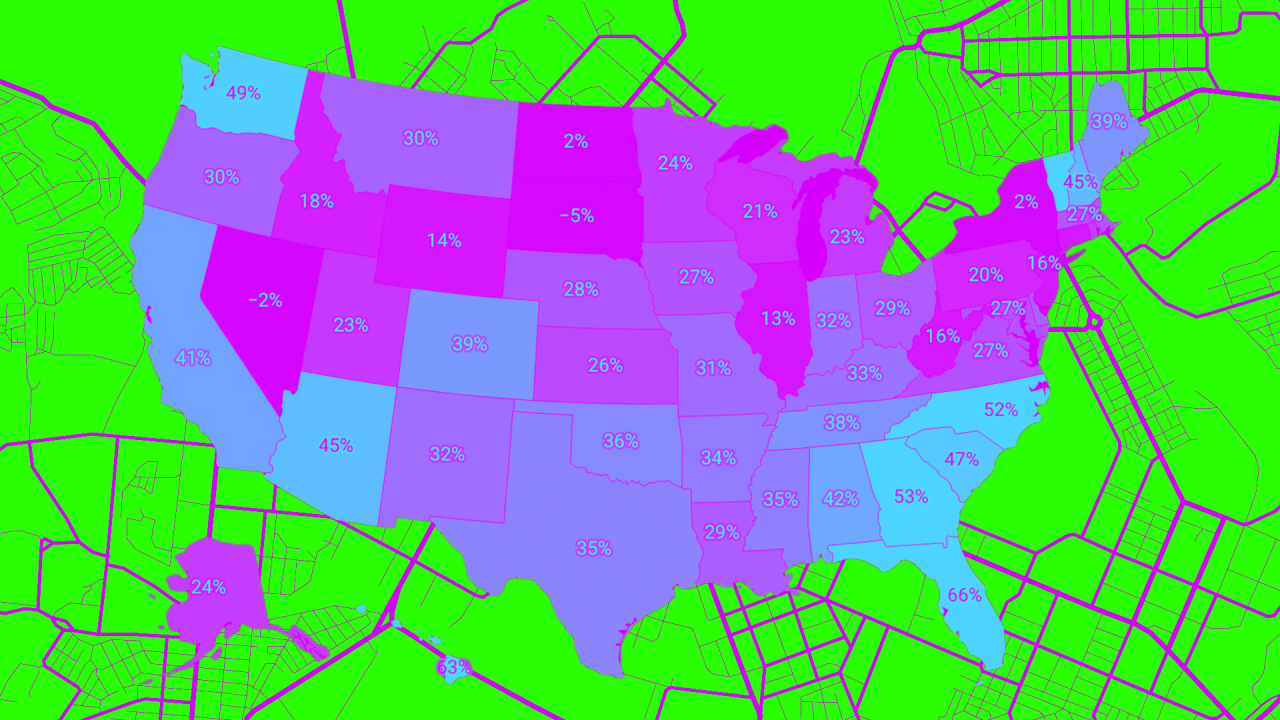
The hottest markets (i.e., where sellers have more power) also happen to be those where active inventory remains tightest—furthest below pre-pandemic levels—and where home price growth is most elevated.
The coldest markets (i.e., where buyers have more power) are those where active inventory has increased the most over the past two years, and where home price growth is the weakest or softest.
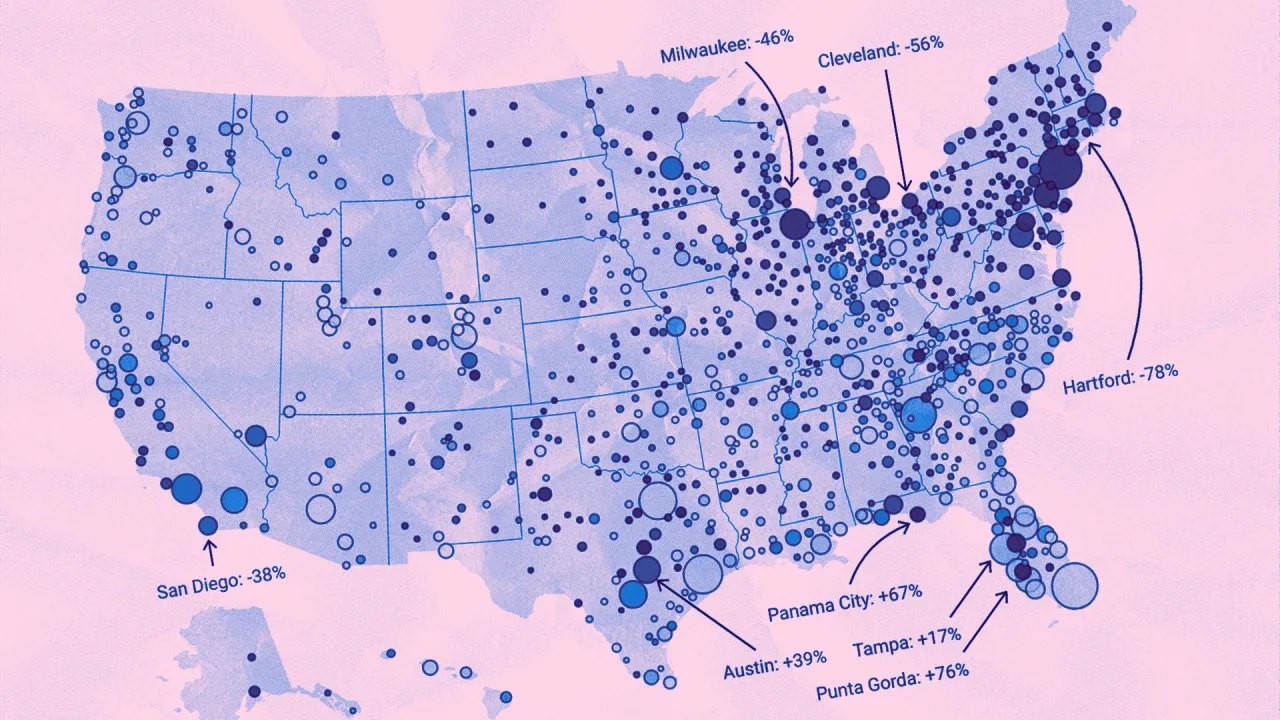
As ResiClub has reported, housing markets in the Northeast, Midwest, and Southern California have been stronger and tighter this year, while many areas in the Sun Belt, particularly resale markets around the Gulf, have been softer/weaker.
Unlike many Sun Belt housing markets, many Northeast and Midwest markets have lower levels of homebuilding. As new supply becomes available in Southwest and Southeast markets—and builders use affordability adjustments like mortgage rate buydowns to move it—that has created an additional cooling effect in the resale market. The Northeast and Midwest don’t have that same level of new supply, so resale/existing homes are pretty much the only game in town.
Another factor driving these trends is that some pockets of the Sun Belt and Mountain West experienced even greater home price growth during the pandemic housing boom, which stretched fundamentals too far beyond local incomes. Once pandemic-fueled migration slowed, and rates spiked, it became an issue in places like Austin, Texas, and Punta Gorda, Florida.