2 months Housing market shift: 6 major markets where home prices are actually falling Fast Company
Want more housing market stories from Lance Lambert’s ResiClub in your inbox? Subscribe to the ResiClub newsletter.
Many housing markets across the country have softened this year. As strained affordability suppresses housing demand, and homes sit on the market longer, active inventory in most housing markets is rising year-over-year.
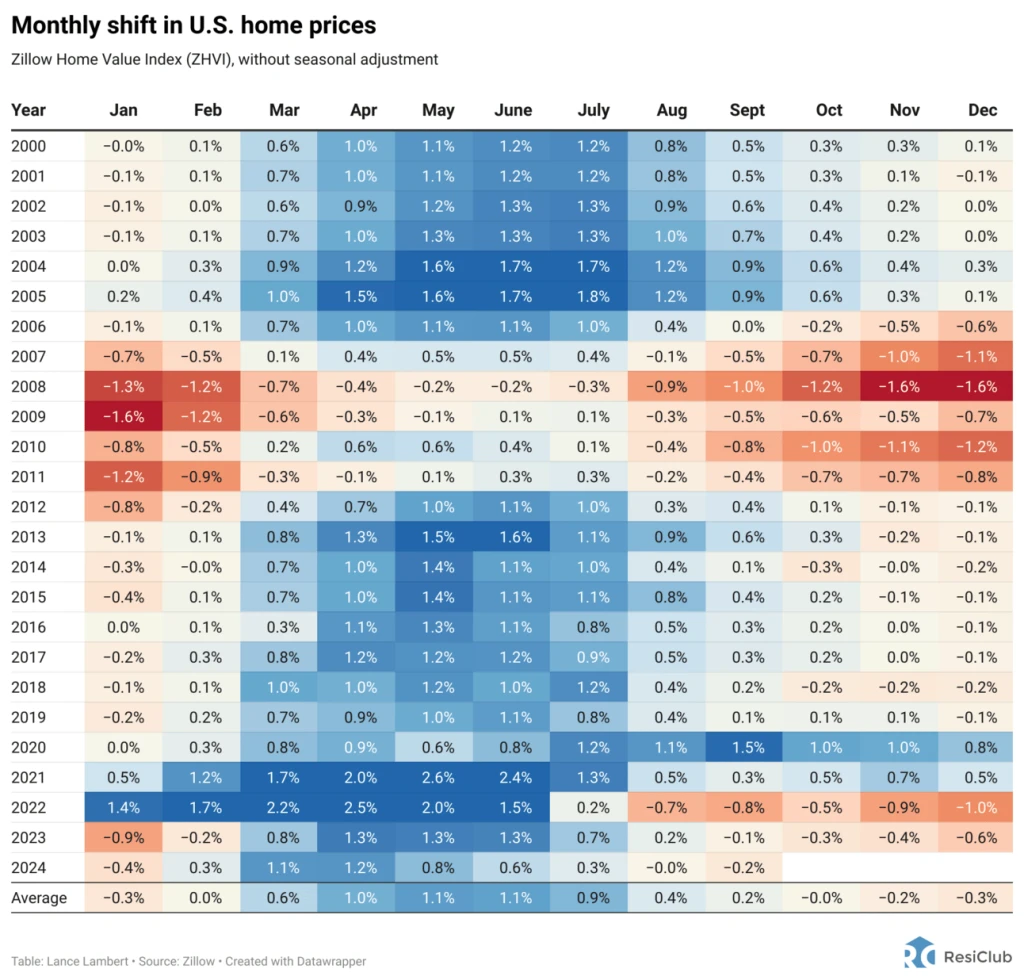
This fall, we’re seeing some softening in home price growth that goes beyond normal seasonality. According to the Zillow Home Value Index, U.S. home prices fell 0.2% month-over-month between August 2024 and September 2024. From a historical perspective, that is fairly soft for this time of year, which is near the start of the seasonally soft fall and winter months. August to September has averaged a 0.2% month-over-month increase since 2000.
This aggregated national housing market softening is regionally concentrated.
Housing markets like Southern California, the Northeast, and the Midwest—where there is low active housing inventory and prices are still up a solid amount year-over-year—are pretty much done posting gains for the 2024 calendar year. However, month-over-month price growth is likely to return in those places come spring 2025.
On the other side, some regional housing markets in states such as Texas, Florida, and Louisiana, where inventory has risen above pre-pandemic 2019 levels, are experiencing mild home price corrections. Many of these markets in correction mode were showing very low or flat price increases during the seasonally stronger spring and summer months. However, now that this period has passed, some Southwest and Southeast markets are starting to post price declines.
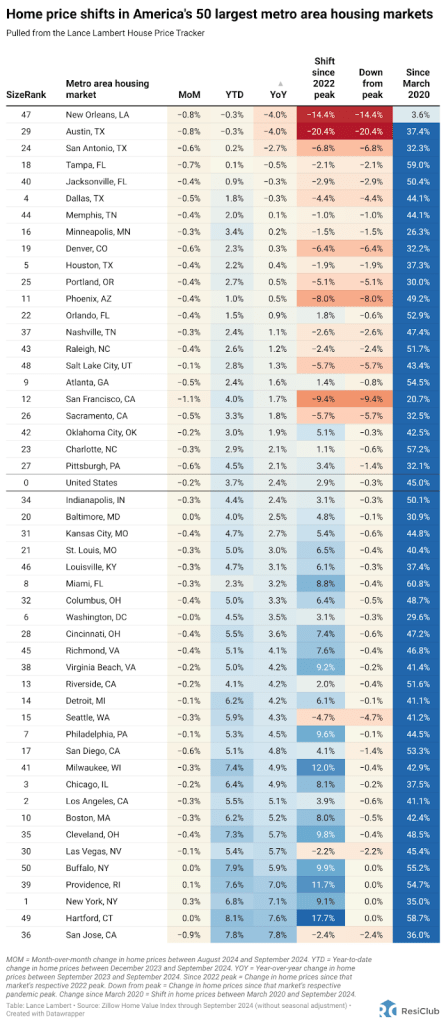
Among the nation’s 50 largest metro area housing markets, these six markets have seen outright year-over-year home price declines over the past 12 months:
- New Orleans, LA: -4.0%
- Austin, TX: -4.0%
- San Antonio, TX: -2.7%
- Tampa, FL: -0.5%
- Jacksonville, FL: -0.3%
- Dallas, TX: -0.3%
The map below shows year-over-year home price changes across all the nation’s major metro and micro areas.
The trend is clear: The biggest housing market shift—toward cooling—is occurring in markets around the Gulf. In many of these areas, pandemic migration has slowed, home prices are stretched compared to local incomes, homebuilders have a large presence with new supply hitting the market, and home insurance costs have spiked.
X