Homebuyers are gaining leverage in these housing markets
Fast CompanyWant more housing market stories from Lance Lambert’s ResiClub in your inbox? Subscribe to the ResiClub newsletter.
When assessing home price momentum, ResiClub believes it’s important to monitor active listings and months of supply. If active listings start to rapidly increase as homes remain on the market for longer periods, it may indicate potential future pricing weakness. Conversely, a rapid decline in active listings could suggest a market that is heating up.
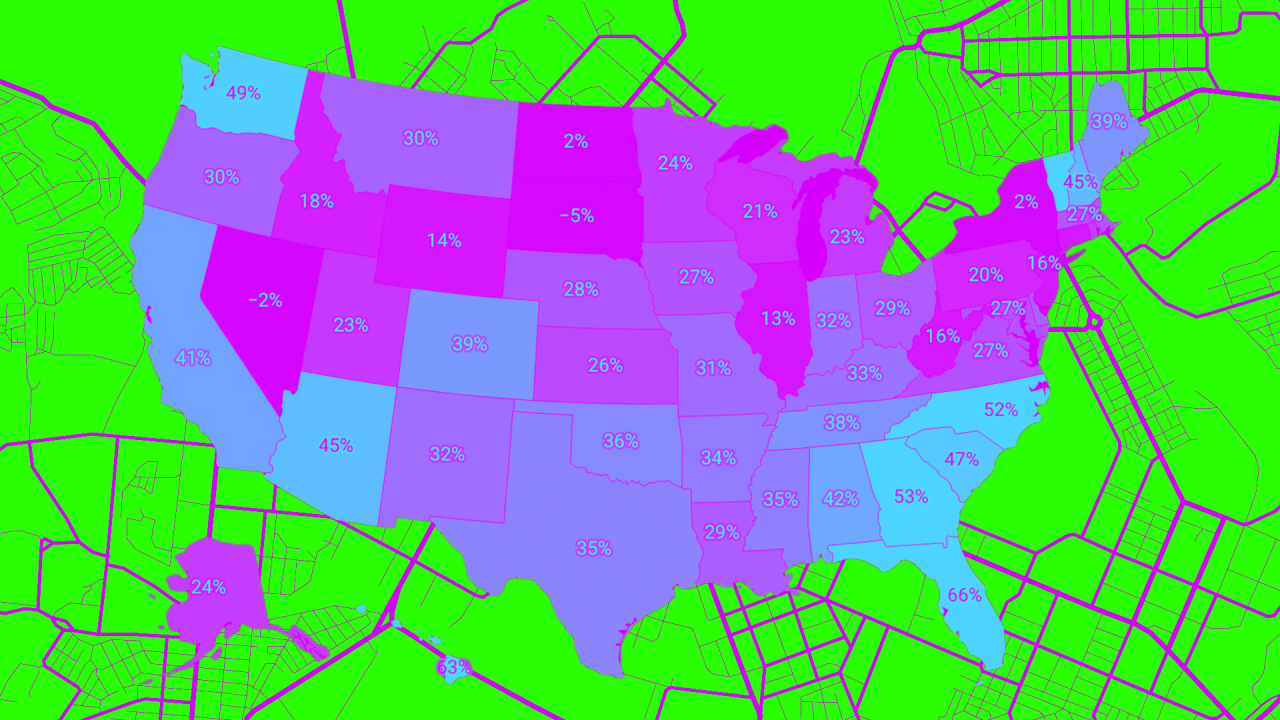
Generally speaking, local housing markets where active inventory has returned to pre-pandemic levels have experienced softer home price growth (or outright price declines) over the past 24 months. Conversely, local housing markets where active inventory remains far below pre-pandemic levels have generally experienced stronger home price growth over the past 24 months.
National active listings are on the rise (up 36% between August 2023 and August 2024); however, they are still well below pre-pandemic levels (26% below August 2019).
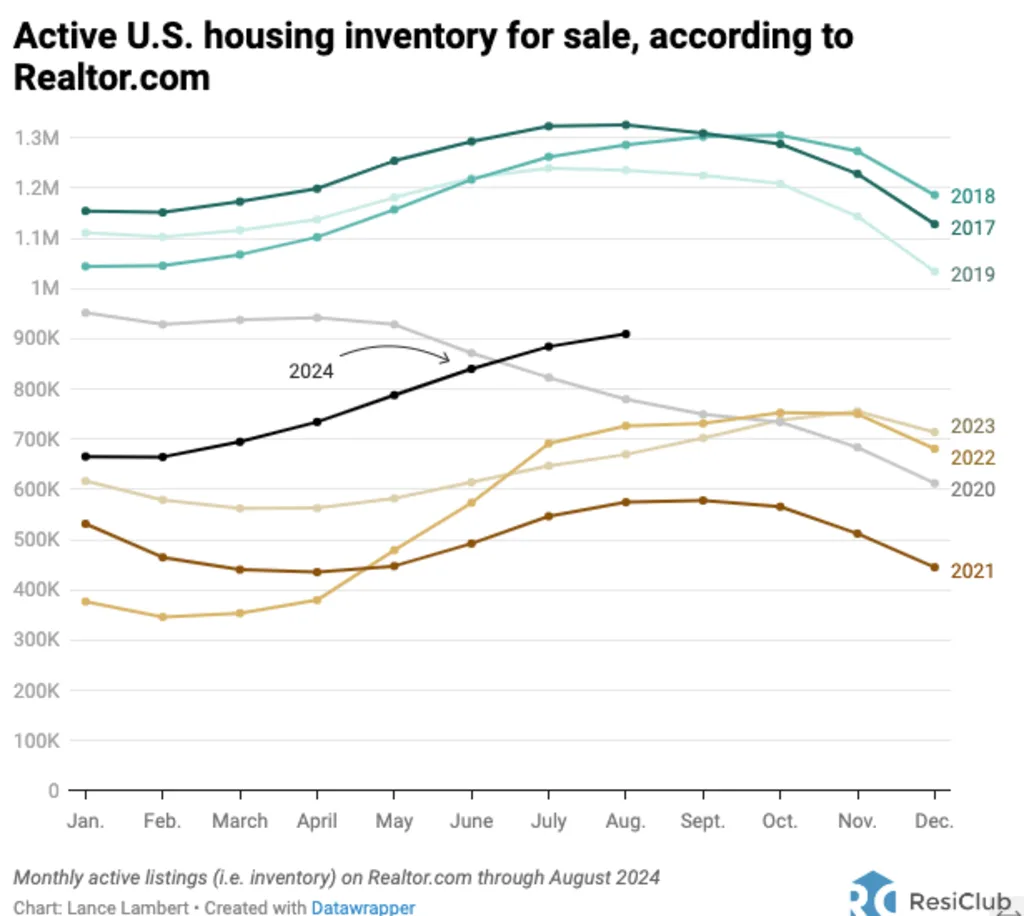
Here are the total number of August inventory/active listings over the past eight years, according to Realtor.com:
August 2017: 1,325,358
August 2018: 1,285,666
August 2019: 1,235,257
August 2020: 779,558 (overheating during the pandemic housing boom)
August 2021: 574,638 (overheating during the pandemic housing boom)
August 2022: 726,779 (mortgage rate shock starts)
August 2023: 669,750
August 2024: 909,344
Among the states with the biggest inventory jumps: Florida.
In Florida, the biggest inventory increases initially over the past two years were concentrated in sections of Southwest Florida. In particular, in markets like Cape Coral, Punta Gorda, and Fort Myers, which were hard-hit by Hurricane Ian in September 2022. This combination of increased housing supply for sale (the damaged homes coupled with strained demand—the result of spiked home prices, spiked mortgage rates, higher insurance premiums, and higher HOAs) translated into market softening across much of Southwest Florida.
However, the inventory increases in Florida now expands far beyond SWFL. Markets like Jacksonville and Orlando are also above pre-pandemic levels, as are many coastal pockets along Florida’s Atlantic Ocean side.
One reason being that Florida’s condo market is dealing with the after effects of regulation passed following the Surfside condo collapse in 2021.
So far, four states have returned to pre-pandemic 2019 inventory levels: Florida, Idaho, Tennessee, and Texas.
Based on recent trends, states that will likely soon join that list include Colorado, Washington, Utah, and Arizona.
Why are Sun Belt and Mountain West markets seeing a faster return to pre-pandemic inventory levels than many Midwest and Northeast markets?
One factor is that some pockets of the Sun Belt and Mountain West experienced even greater home price growth during the pandemic housing boom, which stretched too far beyond local incomes. Once pandemic-fueled migration slowed and mortgage rates spiked, it became an issue in places like Boise and Austin.
Unlike many Sun Belt housing markets, many Northeast and Midwest markets have lower levels of homebuilding. As new supply becomes available in Southwest and Southeast markets, and builders use affordability adjustments like mortgage rate buydowns to move it, it has created a cooling effect in the resale market. The Northeast and Midwest don’t have that same level of new supply, so resale/existing homes are pretty much the only game in town.
Big picture: We’re observing a softening across some housing markets as strained affordability tempers the fervor of a market that was unsustainably hot during the pandemic housing boom. While home prices are falling in some areas around the Gulf, most regional housing markets are still seeing positive year-over-year home price growth. The big question going forward is whether active housing inventory and months of supply will continue to rise and cause more housing markets to see outright price declines.